Search Knowledge Base by Keyword
Getting Started
This article will cover the Verity Analysis settings. Once you have built up a working set of elements and scans to Analyze, you can click the Analyze button in the Verity Viewer. If you have not yet saved your NWF file, you will be prompted to do so. If you click Yes, your NWF will be saved in its current location. If you click No, your file will not be saved. In the event of a crash, loss of power, or anything else that interrupts the analysis and prevents you from saving the NWF in Autodesk® Navisworks®, the connection back to the NWF will be lost. It can be manually recovered later as long as the elements have not changed in the host file. Clicking Analyze will open a dialog showing the Analysis options.
Setting The Right Options
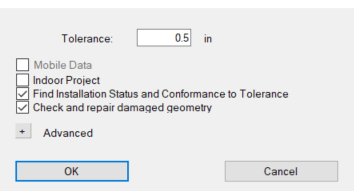
The various fields in the Verity Analyze dialog let you control what algorithms Verity runs and provides some initial guidance for how to process the points.
- Tolerance – This will set the default dimension you want to compare against to define if items are outside of tolerance; it can be overridden per item in the table after the analysis. This dimension also informs the algorithm’s search radius. It is recommended to keep this under 4 inches or 100mm in the current version for both performance and reliability reasons.
- Mobile Data (Technical Preview) – This option is off by default. Checking this option will cause Verity to use a beta algorithm optimized to run on unstructured scan data that meets specific requirements. To have this functionality requires a technical preview license to run, contact support for more information.
- Indoor Project – This option is off by default. When scanning outside, a hole in the scan data (i.e., no return) is usually a result of things being too far away from the scanner to register (e.g., the sky, distant buildings, etc.). In these cases, Verity’s algorithms assume that items with geometry in those locations are missing since there are no recorded scan points. In indoor projects, holes in the data are usually caused by non-ideal surface quality (e.g., highly reflective, shiny, dark, rough, etc.) that the scanner cannot capture well. By checking the “Indoor Project” option, you are telling the algorithm to treat missing data accordingly.
- Find Installation Status and Conformance to Tolerance – This option is on by default. This checkbox controls whether the algorithms attempt to determine the installation status and the conformance to the tolerance of each item in the table. If unchecked, no initial classification is run, and every item will have to be manually reviewed, classified, and fit. When your geometry and scan data are not similar, each piece of geometry will have to be manually adjusted anyway; so skipping this step may make sense as it will cut down the analysis duration significantly.
- Check and Repair Damaged Geometry – This option is on by default. This forces a routine that will check every piece of geometry brought into Verity for mesh corruption issues. Verity will detect any problems and repair them so that the analysis will yield the best results.
Advanced Settings
The Advanced tab at the bottom of the analysis menu allows users to better control how the algorithms interpret your scan data. Please only use these settings if you have a good understanding of how they will impact the analysis results.
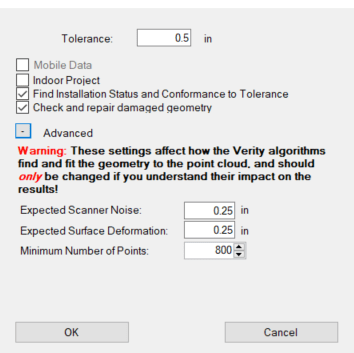
- Expected Scanner Noise – This setting tells Verity’s algorithm the expected range noise in your scan data. If you are using a scanner with higher scan noise, you can increase this setting to ensure that all the relevant scan data is being used to calculate status and fit. If you are using a higher accuracy scanner, then you can decrease this setting to make sure that data from other surfaces very close to the surface you’re analyzing won’t be used to calculate status and fit.
- Expected Surface Deformation – In most cases, the as-built surfaces should have small amounts of deformation from the as-designed. However, for certain types of geometry (rough hand-laid stone walls or beams that are deflecting substantially beyond design tolerances), you may want to increase this setting to ensure all relevant points are being used to calculate status and fit.
- The minimum number of points – Verity has a bottom threshold for which it will calculate a status and fit for an element. Below this number, the algorithms do not produce results that are as reliable as ClearEdge3D would like to provide. However, there are cases where sparse scans can produce good results. The advanced section exposes this threshold so advanced users can modify the value if they feel the results will be good enough for their purposes.
*If you select “Mobile” data from the checkbox in the Analyze dialog, these values will change to different defaults that are appropriate for most mobile scanners.*
The Analyze Progress Bar
Depending on your data set, the Analyze process can be very short (less than a minute) or very long (days). As such, it is important to understand what is going on at different stages in the process.
- 0%-10% – Loading geometry from Autodesk® Navisworks®.
- 10%-35% – Triangle check and repair.
- 35%-100% – Pull points from Autodesk® Navisworks® and analyze with Verity’s algorithms
Armed with this information, if your analysis progress has stalled out between 10% and 35%, you have an item with very complex geometry and the check and repair process is taking a long time. If it has stalled out past 35%, then you likely have unnecessarily dense point cloud data or you’re just testing 10,000 items.
As a companion application to Autodesk® Navisworks®, Verity inherits an issue where Autodesk® products show as “Not Responding” when they are processing information. Please be patient with the analysis. If you want to confirm if Autodesk® Navisworks® or Verity are still working, open the Task Manager, and look at the Autodesk® Navisworks® process. If either the CPU or Memory % numbers are changing, then the application is working.
Canceling the Verity Analysis
If you ever need to cancel the analysis, or you know you want to go back and do something different so the analysis will take less time, please press the Cancel button on the analysis progress bar. It may take a minute or so to cancel if it is in the middle of a complex step. However, this allows Verity to exit the analysis without risking corruption of anything in Autodesk® Navisworks® or Verity. If you cancel, the analysis data calculated thus far will be discarded, and the analysis will be ready to run with different settings.
What Impacts Verity Analysis Duration
The analysis duration is driven by three related factors that are listed in order of impact. First, the amount of time it takes is linearly related to the number of items. Second, the geometric complexity of those items. Third, the total number of points around those items.
Storage Speed and Latency
Both Navisworks and Verity make a lot of requests to your hard drive as data is being exchanged between applications. In applications that do not have massive data sets, this is usually handled in your computer’s memory rather than on disk. However, applications that work with point cloud data are generally working with data sets that are much larger than available memory. As a result, Verity has to store and cache information on disk regularly. Because of this, the speed and latency (time to respond) of your data storage infrastructure has the single most substantial impact on analysis times. ClearEdge3D does not support running Verity on data sets stored on any network drives. Also, it is not recommended to use external hard drives or mechanical hard drives as internal SSDs will provide dramatically better performance. For example, running an analysis through network storage takes around 100 times longer.
Geometry Correction
Checking and fixing the geometry usually takes a small percentage of the analysis time. However, on data sets with extremely complex geometry (tens or hundreds of thousands of triangles per object), this step can increase analysis times significantly.
Number of Points
Verity must load the scans through the Autodesk® Navisworks® API, and this process is particularly slow. This step will take approximately 75% of the total analysis time on most data sets. To minimize this, you can reduce the number of scans you are using for the analysis and reduce the number of points in each scan through downsampling each scan on export. Verity only needs a few thousand points distributed on each item to work well.
Here are three different examples of the same item set being run with three different point cloud densities:
- The full resolution data (8.6 GB) took 21:51 (m:s) to run.
- Exporting every third row/column (2.25GB) resulted in it completing the processing in 7:40, roughly35% of the time the full resolution data took to complete.
- Taking the lower resolution scans and using ReCap’s grid decimation set to 25mm on import (860MB) resulted in a processing time of 2:23, or 11% of the full resolution data.
It is worth noting that the results are slightly different for each setting. There are fewer points on some objects to analyze, and this does have an impact. The fewer number of points has the most significant effect on small objects. For items close to the edge of the defined tolerance range, small changes in the points for analysis will change them from passing to out of tolerance and vice-versa.
Number of Items in a Verity Analysis
The time it takes to run the algorithms (after loading points from Autodesk® Navisworks®) scales linearly with the number of items analyzed. Large complex objects with a lot of points will take longer than smaller objects with fewer points, but the impact is not dramatic. Verity typically processes each item in one to five seconds depending on the size, complexity of geometry, and the number of points on that object.
Expectations for Verity Analysis Duration
While it is tough to predict the duration of a Verity analysis in advance given the number of variables involved, here are a couple of examples to help understand the range of processing times:
- A small project with approximately 150 structural members, 15 scan locations, and optimized scan data (25mmx25mm grid spacing at 10M) took roughly about 10 minutes to process. That is approximately 4 seconds per object analyzed for the entire process.
- A large project with 5000 structural members, 130 scan locations, and high-resolution scan data (6.1mmx6.1mm grid spacing at 10M) took about 46 hours to process. That is approximately 33 seconds per object analyzed for the entire process.
Breaking it down by seconds per object, both of these are relatively fast compared to the manual human QA QC approach. However, very few users will want to wait 46 hours to review 5000 members. Using the information above to optimize the scans and the items you’re testing can have a dramatic impact on overall processing times. Use the information above to help streamline the workflow as you apply Verity to your project.
QA the Verity Analysis
Verity, like any automated analysis, will not be right 100% of the time. The purpose of our tool is to dramatically increase the efficiency of a human by organizing the data and making an initial attempt at the right answer. Our target for our algorithms is 80% correct, plus or minus 10%. Most datasets we have tested fall within that range or exceed it. However, because we cannot be correct 100% of the time, we highly recommend you review each item as part of your QA process. Since Verity cannot tell you the correct resolution to the issue (e.g., move in field or update as-builts), you should be looking at most of the results anyway in order to determine what needs to be done.
Verity Analysis, Reviewing the Results
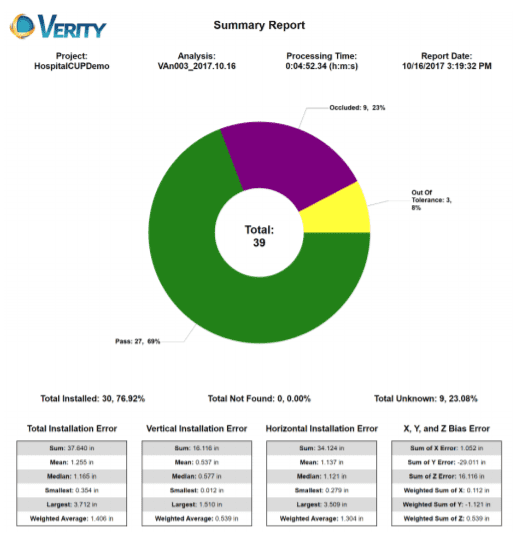
Once the analysis is complete, an HTML summary report will be generated and automatically open in your default internet browser. This report will show you summary information about the analysis. This report includes processing time, the percentage of items in each classification, as well as some aggregate error information. The aggregated errors can help diagnose global issues in your dataset, for example, coordinate system errors. The report can be manually generated at any time through the Reports menu by selecting HTML and then selecting the Summary report. When creating the report manually, Verity will use the active selection rather than running on all items. You can either select the elements you want in advance or hit Esc key to clear the selection, prompting Verity to confirm you want to run on all items.