
Verity’s latest update introduces new options for reviewing and communicating verification data—from redesigned PDF reports to early Power BI and Collage Web capabilities.
The November 2025 release of Verity is all about clarity and communication, making it easier for teams to share verification results, track project performance, and visualize quality across every stage of construction.
This update introduces enhancements to how Verity data is reported and reviewed, with three new ways to deliver insight:
- Smarter PDF reports that are easier to read and share in the field.
- New Power BI dashboard capability, enabling advanced users to connect Verity data to Power BI for fully interactive, data-driven project oversight.
- Collage Web visualization, allowing teams to import colorized Verity analysis results into Collage Web for browser-based review and communication.
Available now, these updates extend Verity’s verification capabilities beyond analysis, giving teams the tools to communicate results clearly, collaborate effectively, and drive action from the model to the field.
Smarter, More Readable Field Reports
What’s New
Verity’s November 2025 release delivers a major upgrade to its out-of-the-box PDF reports. They’re designed to make QA/QC results clearer, more contextual, and instantly useful for the teams who need them most.
While Verity has long supported PDF exports, earlier versions were too technical for broad use. This release rethinks reporting from the ground up, replacing dense data tables with clear visuals and field-ready context.
Every report now includes:
- Grid Location: Pinpoints exactly where each issue occurs on the project grid.
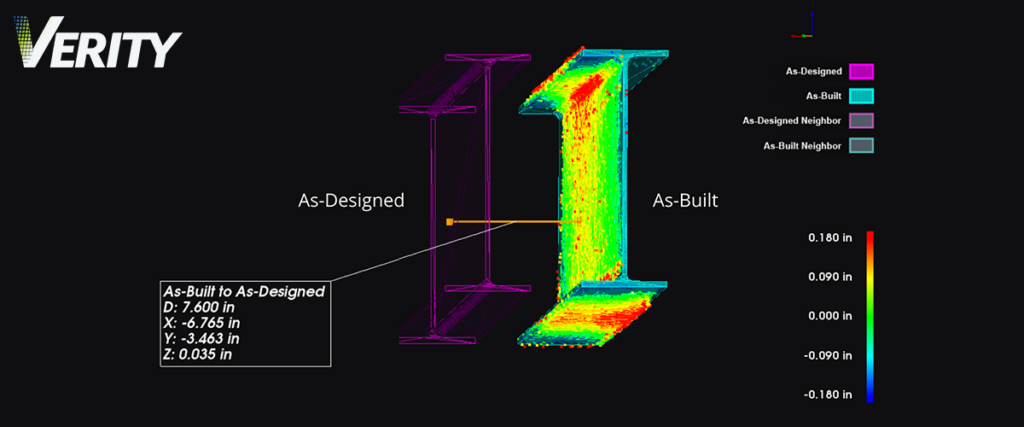
- Northing, Easting, and Elevation Measurements: Displays out-of-tolerance results in familiar construction coordinates instead of X/Y/Z axes.
- Element ID Reference: Makes it easy to cross-check results in Revit or Navisworks without hunting through models.
- Automatic Contextual Screenshots: Each element is now shown in place—within both the point cloud and model view—so users can see the full picture instead of a floating object.
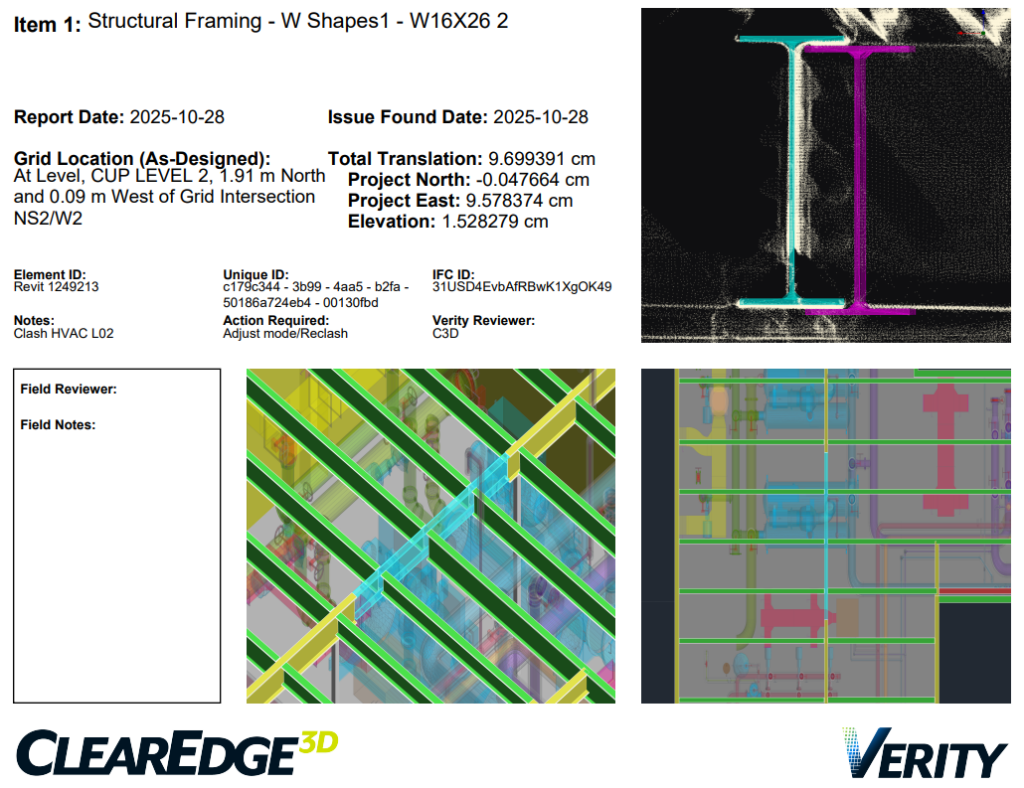
Updated report layouts show precise grid coordinates, real-world measurements, and contextual visuals that help teams understand and act quickly.
Why It Matters
PDFs may not be the flashiest technology, but they’re the most reliable, universal, and trusted format in construction. From RFIs to submittals and building plans to as-built documentation, PDFs have carried projects forward for decades because anyone can open them, share them, and understand them.
By keeping reports in this standard format, Verity ensures that QA/QC insights are easy to access, distribute, and integrate into the workflows teams already use, whether that’s Procore, Autodesk Docs, Bluebeam, or a shared network drive.
And because they’re instantly readable, every stakeholder can take action:
- Project Managers can attach reports directly to RFIs or issue logs to document findings.
- Field Teams can open them on tablets without any special software, using grid and elevation data to locate and resolve issues.
- VDC Coordinators can cross-reference Element IDs back in Revit or Navisworks for quick model updates.
- Executives and Owners can review compiled reports in handover packages, confident that everything was verified and documented.
Verity’s new reports strike the right balance between automation and accessibility by transforming technical QA/QC data into reliable, field-ready documents that connect the office and the jobsite.
In short, Verity keeps things simple, delivering results in a format that’s been helping build the world since the first digital drawings hit the field.
Webinar Replay
Verity Masterclass: New Features, Hidden Power
Interactive QA/QC Dashboards in Power BI
What’s New
Verity data can now be connected to Microsoft Power BI through the Autodesk® Data Connector for Power BI, opening the door to fully interactive QA/QC dashboards and data visualizations.
This is an emerging capability that our team recently validated internally. While it’s not yet a fully productized feature, it’s functional today and provides a powerful new way to explore Verity data outside of Navisworks or Revit.
By linking Verity results through the Autodesk Data Connector, Power BI users can build dashboards showing installation status, tolerance trends, and project progress, and even combine QA/QC insights with schedule or cost data for a broader performance view.
Because dashboards are built natively in Power BI, every team can customize layouts, filters, and KPIs to match how they report or communicate with stakeholders.
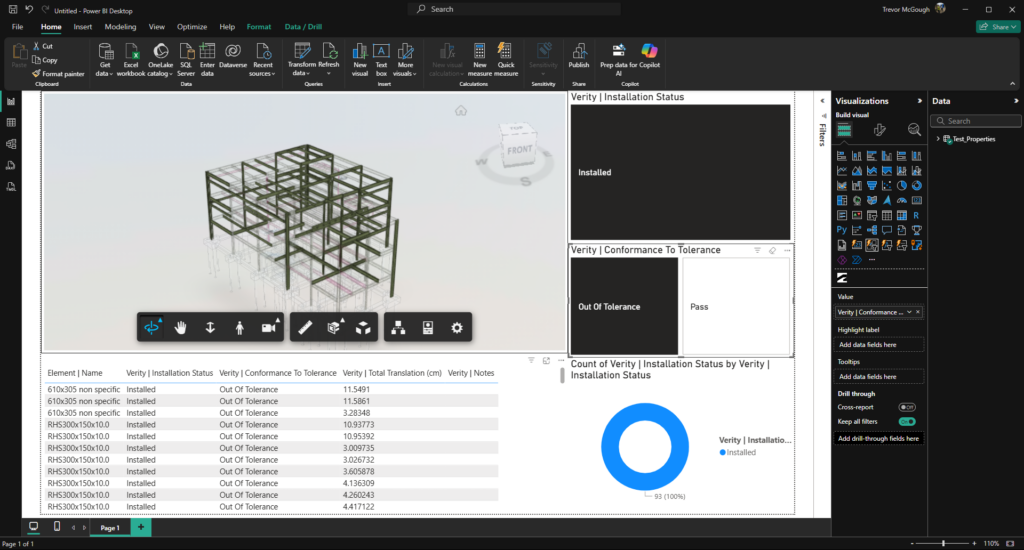
A Power BI dashboard showing installation and conformance status across a steel frame, complete with interactive 3D views and summary charts.
Why It Matters
Power BI dashboards bring a new level of visibility and flexibility to construction QA/QC data.
- Owners and Owner’s Reps get clear, visual summaries of project health and installation accuracy
- Project Executives can track QA/QC performance across trades or areas, and quickly identify trends and risks.
- VDC Teams can merge Verity data with schedule or cost metrics to deliver holistic, data-driven progress reports.
This integration marks the first step toward a more open, connected reporting ecosystem for Verity. We’re continuing to refine how it fits into supported workflows, but we encourage advanced users to explore this capability today and share feedback as we shape its future direction.
Visualizing QA/QC with Collage Web
What’s New
Teams can now view Verity’s colorized analysis results in Topcon Collage Web, enabling browser-based visualization and annotation of QA/QC data.
After completing a Verity analysis, users can export the colorized model and point cloud and import them into Collage Web. This allows stakeholders to explore verification results online—no desktop software required—viewing installation accuracy directly in context with the point cloud and model.
Within Collage Web, the model owner can add annotations to highlight tolerance conditions, call out areas of concern, or provide additional project context,all within an interactive, browser-based viewer.
This is an early-stage capability, available today for teams already using Collage Web who want an accessible, visual way to review Verity results.
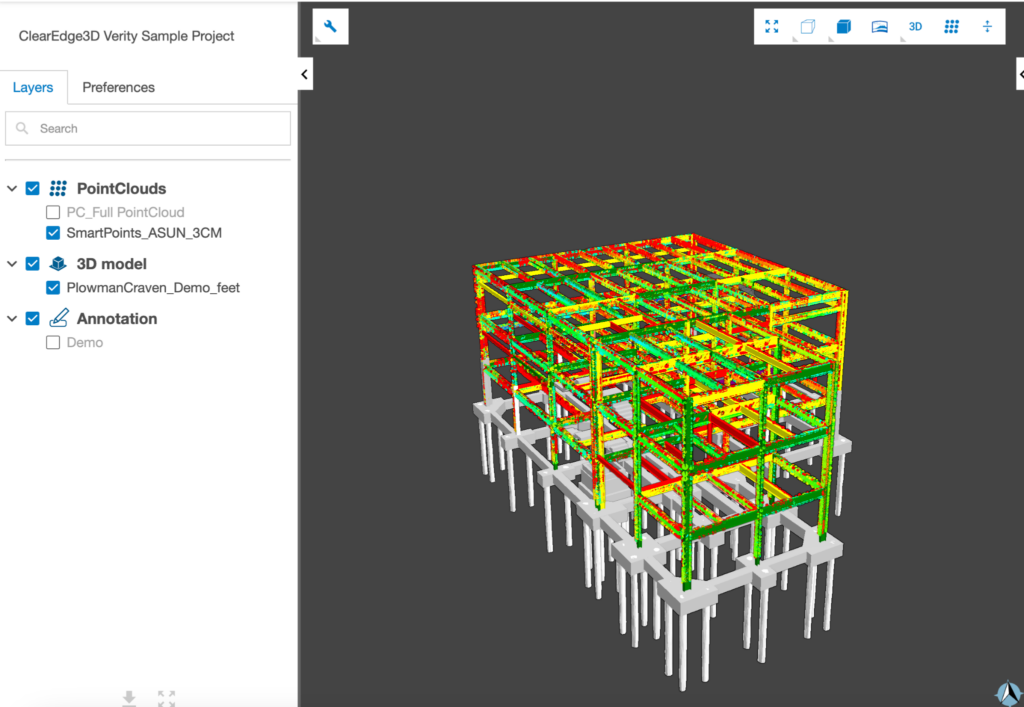
A Collage Web viewer displaying a colorized Verity model overlaid with the point cloud. Users can enable annotations to flag areas for review or discussion.
Why It Matters
Collage Web expands how Verity insights can be shared and understood across teams.
- Field teams can review tolerance colorization and annotations directly from any browser.
- Project managers and clients can see QA/QC outcomes visually without needing Revit or Navisworks.
- VDC teams can use Collage Web as a simple, shareable space for presenting verification results and project context.
This early capability connects Verity’s verification data with the broader Topcon ecosystem, making QA/QC results easier to view, interpret, and communicate online.
Closing the Loop on QA/QC Communication
The November 2025 release builds on what Verity does best, automating construction verification, by making its results clearer, more visual, and easier to share. From field-ready PDF reports to interactive Power BI dashboards and web-based collaboration in Collage Web, Verity can deliver QA/QC insights in the formats teams actually use to make decisions.
Whether you’re verifying work in the field, tracking performance in the office, or reporting progress to project owners, Verity gives every stakeholder a clearer picture of installation quality and project accuracy.
In sum, this release is about strengthening the connection between data and decisions, ensuring that the insights uncovered in Verity are accessible, understandable, and actionable across the entire project team.