This article will cover the Settings found within the Inspector Toolbar. These settings will adjust various parameters for the Floor Flatness and ADA functions. For an overview of these tools, refer to this article.
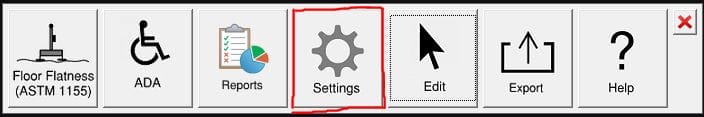
Fig 1: Inspector Tool Bar
The Inspector Settings button is located in the Inspector Toolbar. Here you can adjust settings and parameters for General use, ADA, and FF/FL.
General
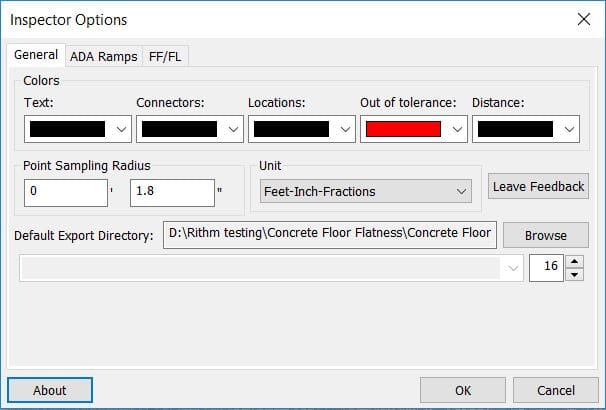
Fig 2: Inspector Options
Colors – Controls the colors of visual elements.
Point Sampling Radius – When performing any points analyses, any points within this radius value are used in calculation of varying parameters
Unit – The unit settings for distances.
Leave Feedback – Click this button to leave feedback.
Default Export Directory – The default directory for exported files.
Text Size – The size of the text on the screen.
ADA
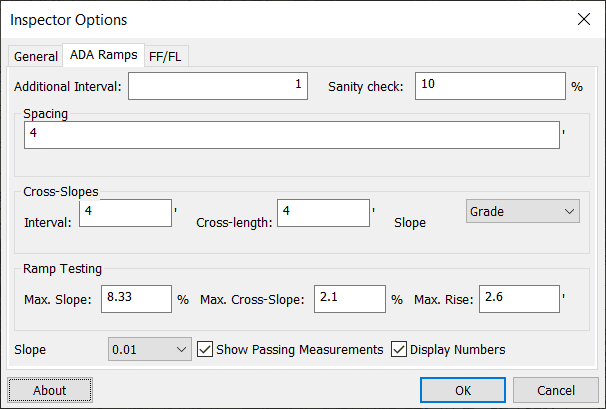
Fig 3: Inspector Options ADA
Additional Interval: Interval of how often the longitude (main direction down the ramp) slope values appear.
Sanity Check: Controls passing tolerance of the Ramps Analysis. If a Ramps Analysis would exceed this tolerance value, it will be flagged as failed.
Spacing: The spacing in between cross slope measurements along the ramp analysis.
Interval: The interval spacing of how often a cross slope is measured.
Cross Length: Controls the length of the cross slope measurements.
Slope Units: Allows you to change between Degrees and Grade for the parameters.
Ramp Testing: Sets the tolerances for the ramp analysis.
Slope Precision: Sets the level of decimal precision for Ramps Analyses.