Search Knowledge Base by Keyword
Getting Started
This article will cover the Points tool found under Analysis in the Builder Toolbar. You can use the Points tool to spot check elevation points in your point cloud. You can find this tool under the Analysis button in the Builder Toolbar.
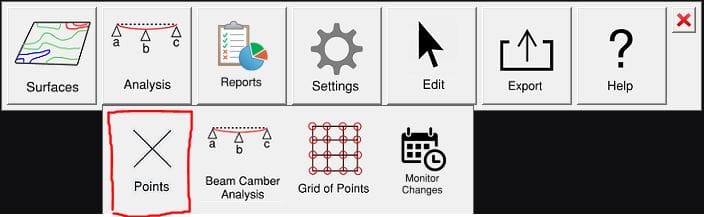
To use this tool, select the Points button from the Analysis sub menu. You will then see a labeling dialog box where you can edit point information that is visually tagged with each point you create.
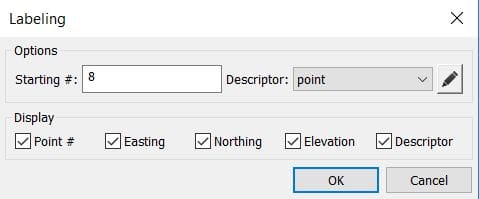
Starting #: Specifies the starting number from which the point numbering begins.
Descriptor: Allows you to categorize your points. Clicking the pencil icon allows you to add or delete various descriptors. You can choose your created descriptor by using the drop down menu.
Display: Controls the display elements of the label for each point.
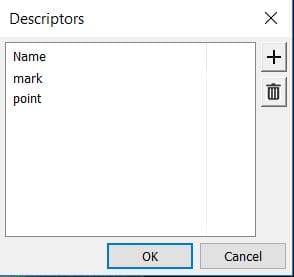
The + button allows you to add a descriptor the the list of descriptors.
The trashcan button allows you to remove the selected descriptor.
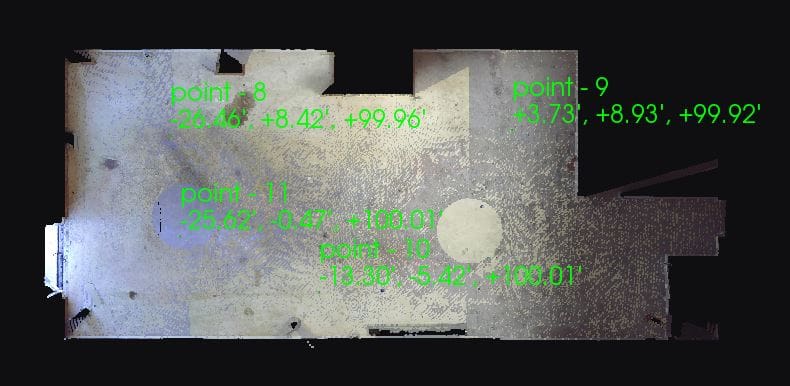
Once you have your settings adjusted to your liking, you can begin left clicking on areas of your point cloud where you would like to place your points. Press enter when done.
Once you are satisfied with your results, you can click the Reports button in the Builder Toolbar to open up the builder reports. Select Ground to view your data.
Report
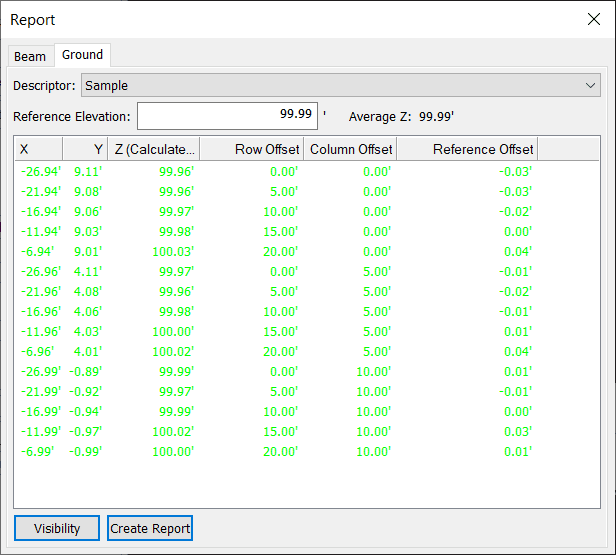
- Reference Elevation: The elevation used to reference the analysis of the generated points.
- Descriptor Dropdown: Allows you to change between different descriptor’s results in the report table.
- X, Y and Z: Coordinate values in the X and Y plane of the project followed by the elevation value for the point. In other words, the Easting, Northing and elevation values.
- Offsets: Distance of the point in the Row / Column axis from the first point in the grid.
- Reference Offset: Difference of the elevation values from the reference value.
Visibility and Coloring
The Visibility Settings allow you to change labeling and coloring for your report.
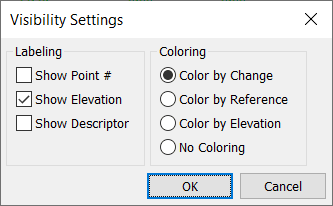
- Checking Show Point # will display the point number in your report.
- Show Elevation will show the elevation value for the point.
- Checking Show Descriptor will display the descriptor label for the point.
- If you check Color by Change, Rithm will color the points according to the change in elevation from previous data.
- Color by Reference will color the points in relation to the defined reference height.
- Color by Elevation will color the points in relation to the median elevation value.
- Checking No Coloring will not color the points.
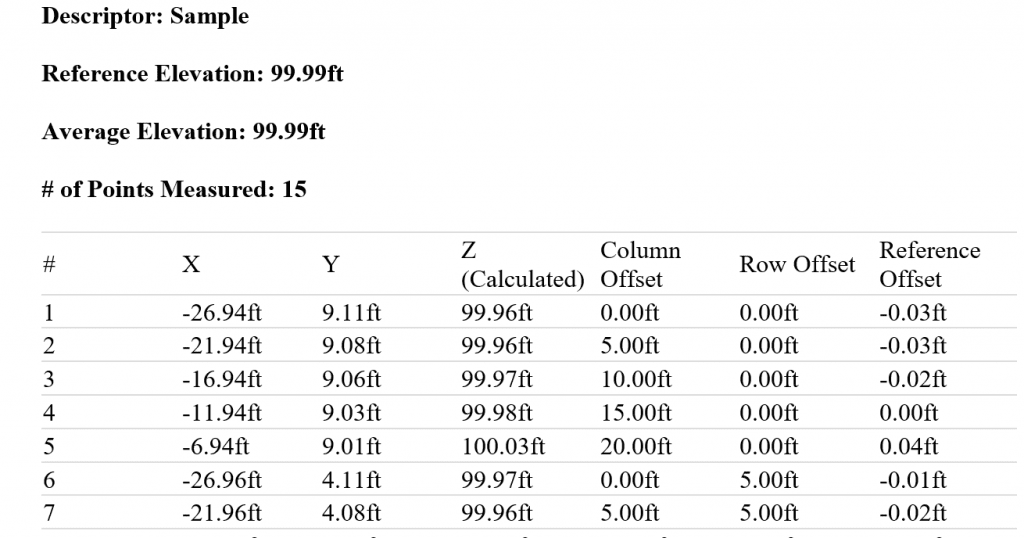
Once you have your visibility settings in order, you can click Create Report. This allows you to publish a PDF or Word document report of the point elevations.
This tool is very similar to Grid of Points. If you would like to learn how to use the grid of points tool, please click here.