Search Knowledge Base by Keyword
Getting Started
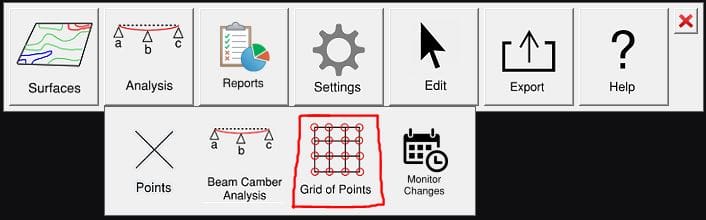
This article will cover how to utilize the Grid of Points tool. A grid of points is a section of elevation points that are shown over a defined area of your point cloud. This tool allows you to define the width, depth, and spacing, which Rithm will use to array points following your settings. You can find this tool in the Analysis section of the Builder toolbar. If you were instead looking for information on the Points tool, refer to this article.
Grid of Points Creation Settings
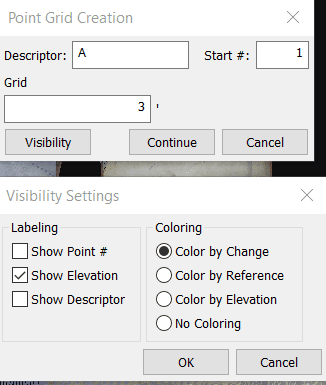
After clicking the tool, the following options become available:
- Descriptor: The descriptor is a text tag that acts like a label for the point.
- Start #: Determines the starting point number when arraying the grid of points.
- Grid spacing: Determines the spacing between points arrayed in the grid.
Visibility Settings
In the Visibility Settings dialog box, you can determine the coloring and shown labels of your points.
Coloring
- Change: Colors the points according to the change in elevation from previous data.
- Reference: Colors the points in relation to the defined reference height.
- Elevation: Colors the points in relation to the median elevation value.
- No Coloring: Will not color the points
Labeling
- Point #: Displays the point number.
- Elevation: Shows the elevation value for the point.
- Descriptor: Shows the descriptor label for the point.
Workflow
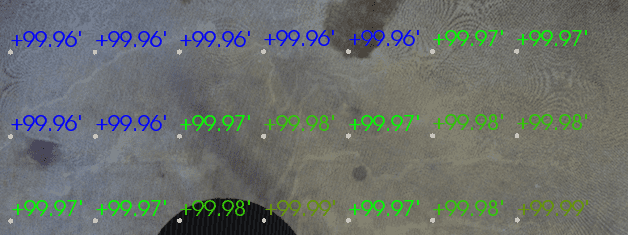
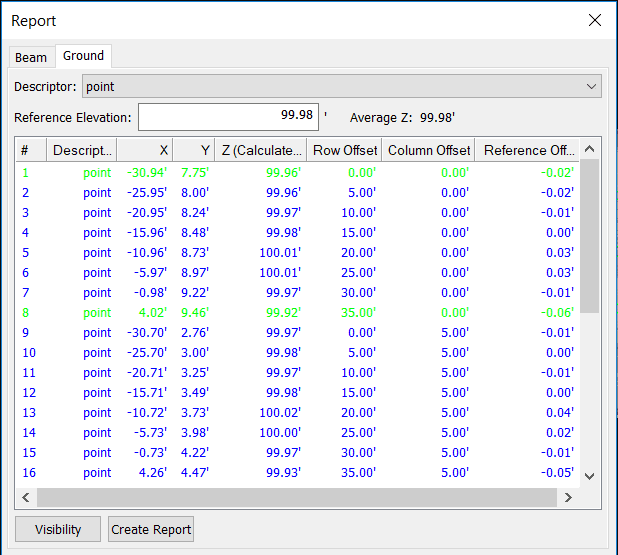
To start, begin by left clicking where you want the corner of the grid to be. Then, left click to define the total length of the grid. Lastly, left click to define the width of the grid. Once you have created your grid, you can confirm to move forward, or redo to re-make it. Once you click Confirm, a report dialog will appear. Here you can view a table format of your grid of elevation points as well as edit visibility settings and create a report.
If you click the Create Report button, a report creation dialog will open. From here you can choose to have the report be made into a word document or pdf, choose a save location, and chose what units you would like the report to be created with.
- Reference elevation: The elevation used to reference the analysis of the generated points.
- Descriptor Dropdown: Allows you to change between different descriptor’s results in the report table.
- X, Y, Z: Coordinate Values under the X and Y columns show where the point is in horizontal space, while the Z (Calculated) is the elevation value of the point.
- Row Offset: This value is the distance from the starting corner of the grid for the row of each point.
- Column Offset: This value is the distance from the starting corner of the grid for the column of each point.
- Reference Offset: Difference of the elevation values from the Reference Elevation.
Visibility Settings
You can further edit the visibility settings after the Grid Of Points has been created. Changing these settings is the same as mentioned above.
Export
You can either export out your analysis as a .DXF file, .CSV file, or as Ground Monitoring Points which can be used in the Monitor Changes Workflow.