Search Knowledge Base by Keyword
Getting Started
This article will cover how to use the Contour Map tool in Rithm. The overview of contour map creation is defining an area to be analyzed, adjusting your settings, and then exporting out your result. We recommend applying a debris filter before moving onto map creation.
Creation
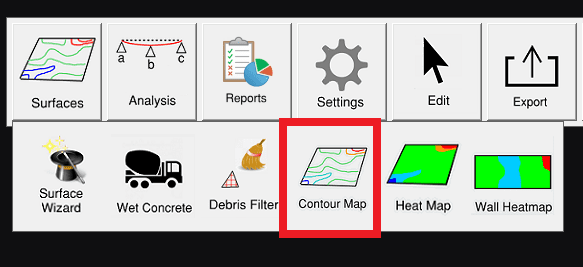
There are two methods for contour creation. First, by clicking on Add Surface after a debris filter has been run. Second, by clicking Contour Map under the surface tool and left clicking to define the area.
Main Contour Settings
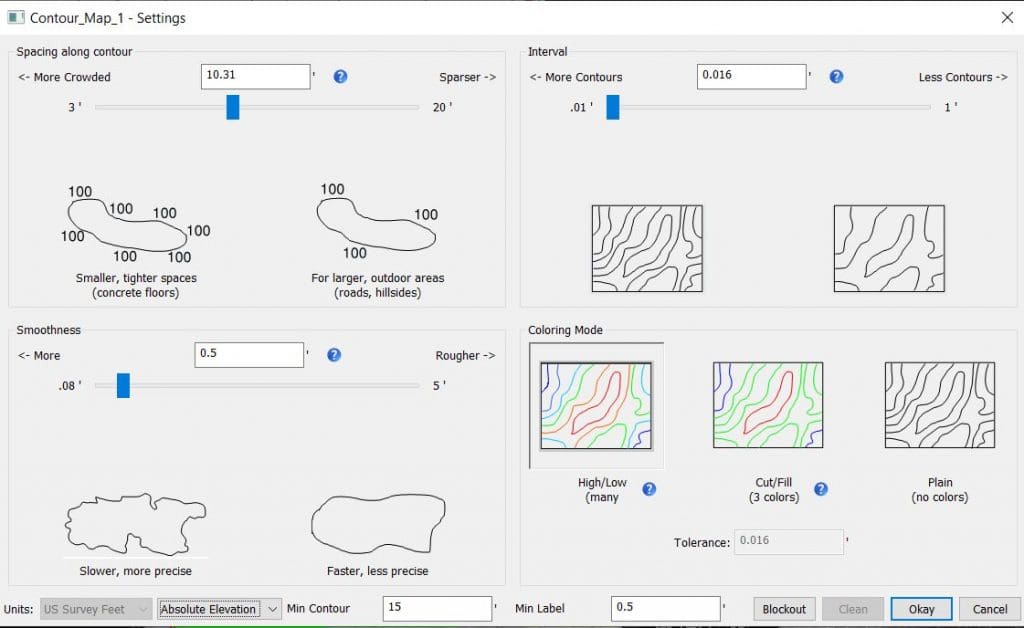
Spacing Along Contour: Controls the interval distance between contour elevation labels. The more crowded the spacing, the more elevation labels will appear on and around your contours. The less crowded the spacing, the less elevation labels will appear. It is usually recommended to apply this setting somewhere in the middle of the bar as too many labels will make it harder to see your contours, while too little will make it harder to identify a contour’s elevation.
Interval: Determines the elevation intervals between the contours and controls the total number of contours that will be created. This setting determines the distance interval at which new elevation contours are drawn. For example, if you want to track elevation change at a ¼”, then you would adjust this setting to .25”. For concrete slabs, we generally recommend lower values – fractions of inches and for non-concrete slab floors, we recommend trying higher values.
Smoothness: Determines the number of segments used to draw the contour. If you want more precise contours, move the slider to the left. If you care about speed over accuracy, move this slider to the right. Contours for concrete slabs should use the most precise smoothness setting, while non-slab floors can use rougher, less precise smoothness values.
For Coloring Mode:
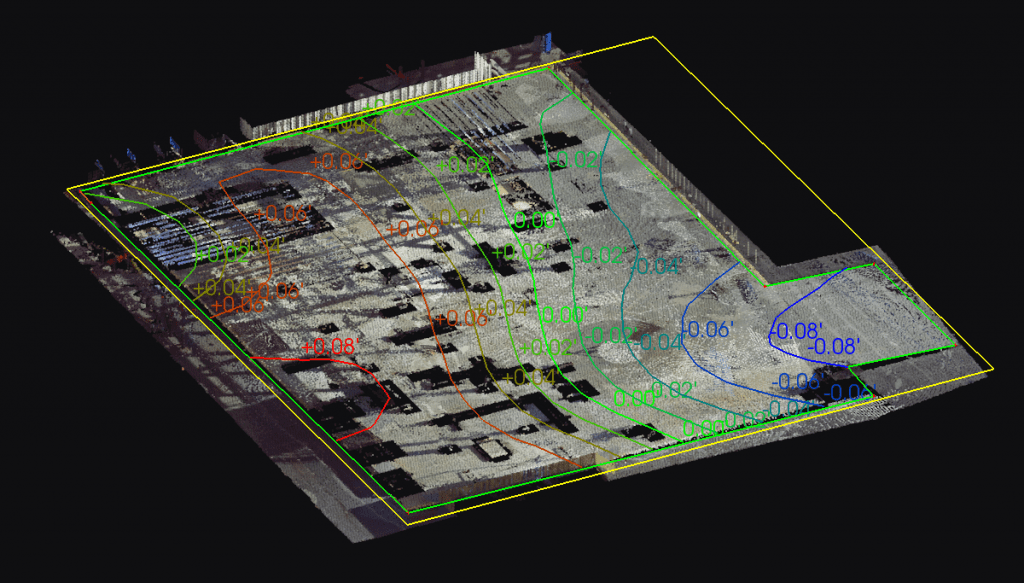
High / Low: Contour Lines will have multiple colors reflecting the different elevation. This means each color band will represent the change of the defined tolerance.
Cut / Fill: Provides 3 colors. Red for above tolerance. Green for in Tolerance. Blue for below tolerance.
Plain: The contour lines will contain no color.
Tolerance: The elevation above and below the base elevation that determines if the point is to be shown cut or filled if the Coloring Mode is Cut/Fill.
Alternative Contour Settings
Min Counter Length: Specifies the minimum length of contour lines to keep. Contours shorter than this value will be filtered out, so set this to eliminate unwanted short contours.
Min Label Spacing: Specifies the minimum distance between neighboring contour labels. Labels closer than this distance will be filtered out. Set to prevent label overlap.
Blockout: Use this before clicking OK to specify one or more slab regions to ignore. Use around scan shadows, unfiltered debris, and any other problematic areas.
Clean: After extraction contours, eliminated contours in one or more slab regions. Use around any problematic areas such as previously unnoticed debris. If a problematic area is known in advance of contour extraction, prefer the Blockout tool as it will yield cleaner results.
Export
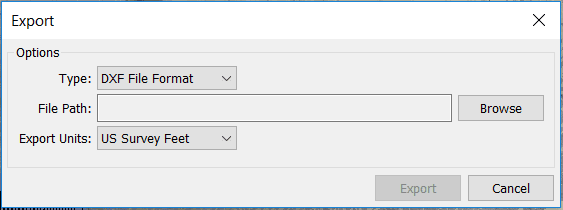
Once you determine your settings and make sure there is an active Contour Map, you can proceed to export. Click on the Export button in the Builder Tool Bar and ensure the dropdown menu is set to .DXF. Next, determine your export units by clicking the Export Units dropdown menu and then click the Browse button to change your File Path. When finished, click Export.