Search Knowledge Base by Keyword
Getting Started
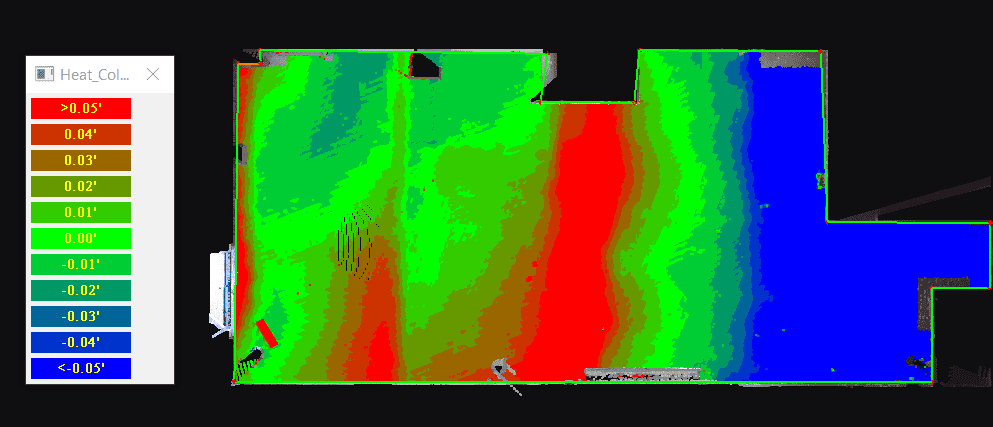
This article will cover the creation of a heat map. This offers a powerful tool by coloring the floor points to show varying high and low spots. It is recommended to apply a debris filter before starting this workflow.
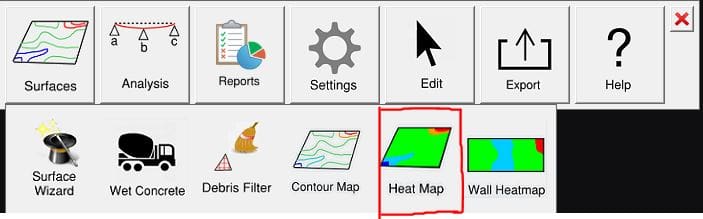
There are two methods for this type of map creation. First, by clicking on Add Surface after a debris filter has been run. Second, by clicking Heat Map under the surface tool and left clicking to define the area.
Heat Map Settings
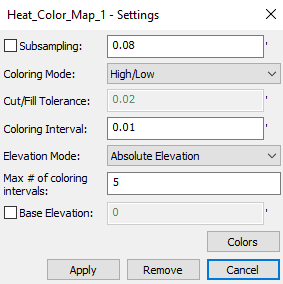
Subsampling reduces the density of the point cloud, causing fewer points to be calculated in the generation of the Heat Map. Think of this as a decimation grid.
The coloring mode defines what style map will be created.
- High / Low: Multiple colors representing different elevation values.
- Cut / Fill: Produces three colors. Red is above tolerance. Green is in tolerance. Blue is below tolerance.
Cut/Fill Tolerance is the tolerance value for the cut/fill map. Points above the distance interval from the median elevation show colors above tolerance. Points below the distance interval from the median elevation show colors below tolerance.
Coloring Interval is the distance of how much “change” a single color band in the high/low map represents.
For Elevation Mode:
- Relative Elevation: Displays “0” as the median and elevation values in intervals from “0”.
- Absolute Elevation: Displays the elevation values as rerecorded by the scanning instrument.
Max # of Coloring Intervals defines how many color bands are above and below the zero value in the high / low map selection.
Check the Base Elevation box and enter in an elevation value. This will define the new center plane that the map values will be in relation too.
Colors opens a dialog to specify custom colors for the High/Low areas.
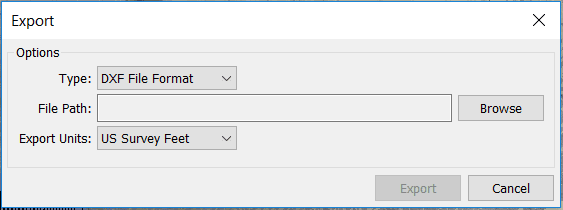
Export
Use the Export feature in the builder tab to export the heat map as a .XYZ file, or a .DXF file. Once exported, if you chose .XYZ, you can open the file in Recap, save it as an RCP file, and then append it into your Navisworks project.